
Understanding RSI Divergence for Trade Entry
Trading in the financial markets involves a lot of analysis, strategy, and understanding of various indicators. One such indicator is the Relative Strength Index (RSI), which is used to identify potential buy and sell opportunities. An advanced concept related to RSI is RSI Divergence, which can be used for trade entry. This article will delve into the concept of RSI Divergence and how it can be used effectively for trade entry.
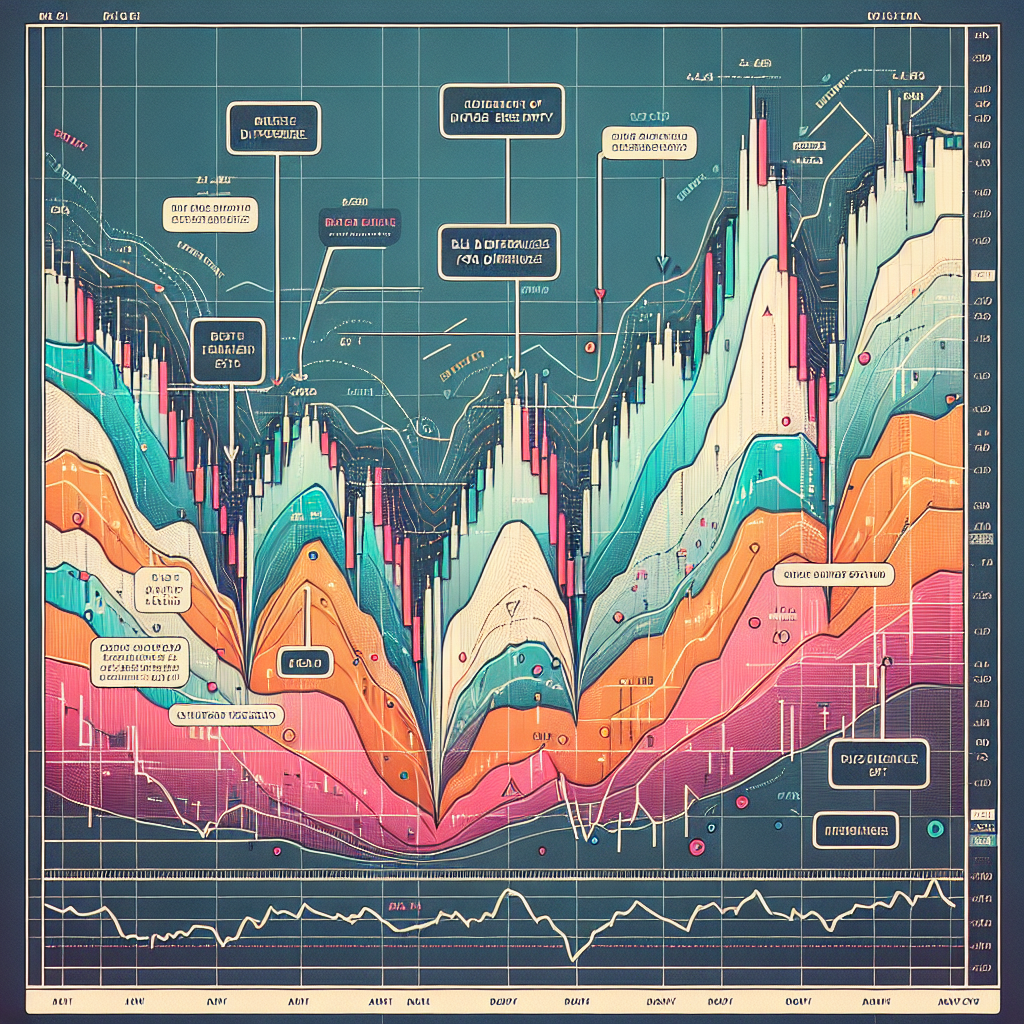
What is RSI Divergence?
RSI Divergence is a discrepancy between the price action and the RSI indicator. It is a situation where the price of an asset and the RSI move in opposite directions. This divergence can be a powerful signal for a potential price reversal and can therefore be used to identify entry points for trades.
Types of RSI Divergence
There are two types of RSI Divergences: bullish and bearish. A bullish RSI Divergence occurs when the price makes a lower low, but the RSI makes a higher low. This indicates that the downward trend is losing momentum and a potential upward reversal could be on the horizon. Conversely, a bearish RSI Divergence occurs when the price makes a higher high, but the RSI makes a lower high. This suggests that the upward trend is losing steam and a potential downward reversal could be forthcoming.
Using RSI Divergence for Trade Entry
RSI Divergence can be a valuable tool for identifying potential trade entry points. However, it’s essential to remember that, like all indicators, it’s not foolproof and should be used in conjunction with other forms of analysis.
Identifying RSI Divergence
The first step to using RSI Divergence for trade entry is identifying its occurrence. This involves keeping a close eye on both the price action of the asset and the RSI indicator. If the two start moving in opposite directions, it could be a sign of an impending price reversal.
Confirming RSI Divergence
Once a potential RSI Divergence has been identified, it’s crucial to confirm it before making a trade. This can be done by looking for other indicators of a potential price reversal. For example, a bullish RSI Divergence could be confirmed by a subsequent increase in buying volume, a bullish candlestick pattern, or a breakout above a key resistance level.
Setting Stop Losses and Take Profit Levels
After confirming the RSI Divergence and entering a trade, it’s important to set stop losses and take profit levels. Stop losses can limit potential losses if the price doesn’t reverse as expected, while take profit levels can ensure profits are secured if the price does indeed reverse.
In conclusion, RSI Divergence can be a powerful tool for identifying potential trade entry points. However, it’s essential to use it alongside other forms of analysis and to always set stop losses and take profit levels to manage risk effectively.