# Identifying Key Support and Resistance Zones
Understanding the concept of support and resistance zones is crucial for traders and investors who rely on technical analysis to make informed decisions about buying and selling securities. These zones help identify potential turning points in price movements, providing insights into market sentiment and future price actions. This article will guide you through the process of identifying key support and resistance zones in financial markets.
What are Support and Resistance Zones?
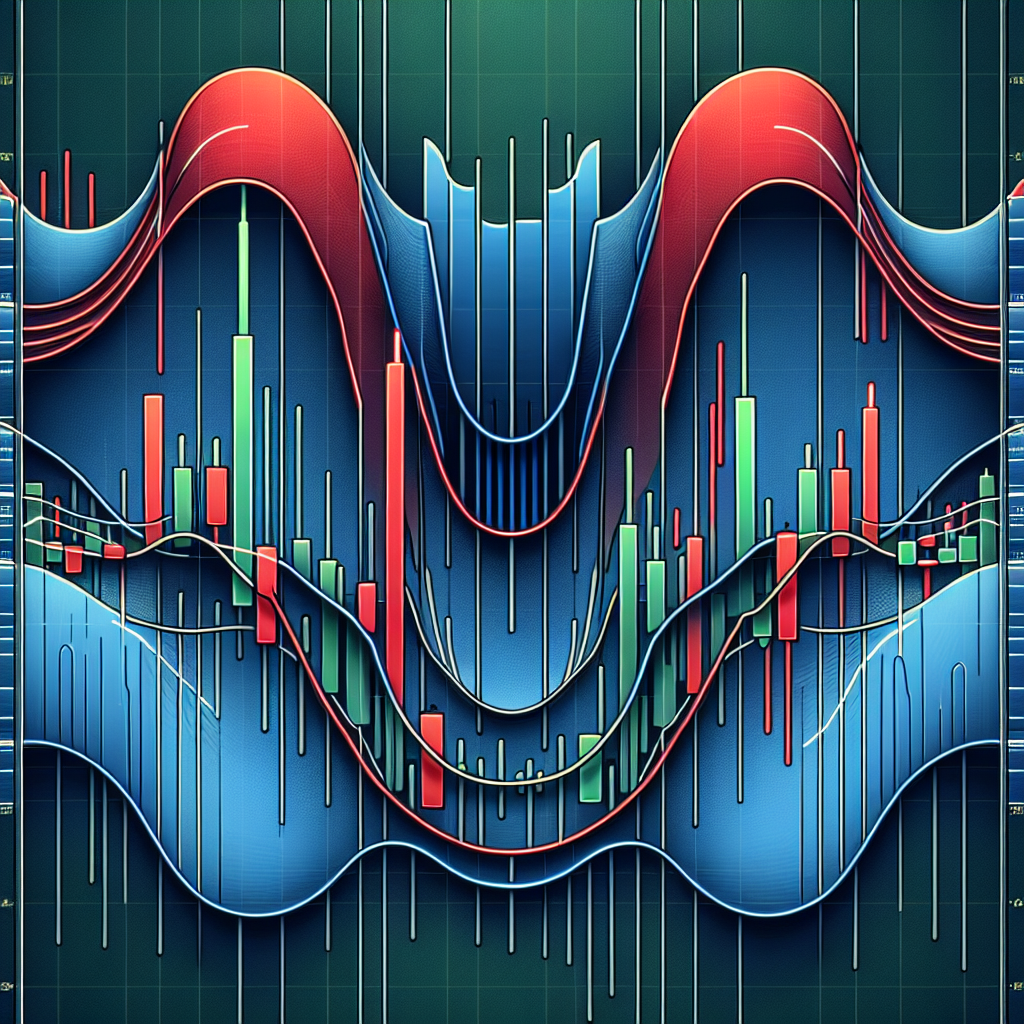
Support and resistance zones are fundamental concepts in technical analysis used to predict the future movement of asset prices. A **support zone** refers to a price level at which a downtrend can be expected to pause due to a concentration of demand. As the price of an asset approaches this zone, buyers become more inclined to buy, and sellers become less inclined to sell. Conversely, a **resistance zone** is a price level at which a trend can pause or reverse due to a concentration of selling interest. Here, as the price of an asset rises towards this zone, sellers become more likely to sell, and buyers become less likely to buy.
Identifying Support and Resistance Zones
Identifying these zones is a skill that can significantly improve your market analysis. Here is a systematic approach to finding these zones:
Step 1: Understand the Market Conditions
Before identifying support and resistance levels, it’s important to have a clear understanding of the market. Analyzing historical price data and market trends can give insights into potential future movements.
Step 2: Use Technical Indicators
Several technical indicators can help identify support and resistance zones. These include moving averages, Fibonacci retracement levels, and Bollinger Bands. Utilizing these tools can provide a more objective viewpoint on where these zones might lie.
Step 3: Spot Swing Highs and Lows
Swing highs and lows are points where the market turns and shifts in the opposite direction. These points can serve as initial markers for potential support and resistance zones. By connecting these points using trend lines, you can visualize these critical areas more clearly.
Step 4: Look for Price Consolidation Areas
Price consolidation occurs where price moves within a bounded range for an extended period, indicating balance between buying and selling pressures. These areas are often precursors to significant price movements and can highlight key support and resistance zones.
Step 5: Monitor Psychological Price Levels
Psychological price levels, such as round numbers (e.g., 1.3000 in the forex market), often serve as informal support and resistance zones because traders and investors tend to place orders at these levels. Monitoring these levels can provide additional insights.
Step 6: Confirm with Volume
Volume analysis can confirm the strength of support and resistance zones. Higher trading volumes at certain price levels indicate strong buyer or seller interest, reinforcing the significance of these zones.
Importance of Time Frames
The relevance of support and resistance zones can vary significantly across different time frames. While day traders might focus on minute or hour intervals, long-term investors may analyze daily, weekly, or monthly charts. It is essential to align your analysis with your trading or investment strategy.
Conclusion
Identifying key support and resistance zones is an essential skill for anyone involved in trading or investing. While it requires practice to perfect, it can provide valuable insights into market trends and potential reversal points, helping to inform buying and selling decisions. Remember, no tool or technique guarantees success in the financial markets, but understanding how to leverage support and resistance zones can significantly enhance your market analysis toolkit.