Introduction to Chart Patterns
Chart patterns are essential tools in the arsenal of every trader or analyst in the financial markets. They are specific formations on the price charts that help predict future movements based on historical data. This article will delve into the most common chart patterns, offering a guide on how to identify and interpret them for better decision-making.
The Importance of Chart Patterns
Chart patterns are crucial because they reflect the underlying market sentiments of fear, greed, and the supply-demand equilibrium at certain price levels. Recognizing these patterns helps traders and investors gauge potential market directions, providing opportunities to enter or exit trades profitably.
Key Categories of Chart Patterns
Chart patterns broadly fall into two categories: reversal and continuation patterns. Reversal patterns signal that the current trend is likely to change direction, while continuation patterns indicate that the trend is expected to persist.
Identifying Common Chart Patterns
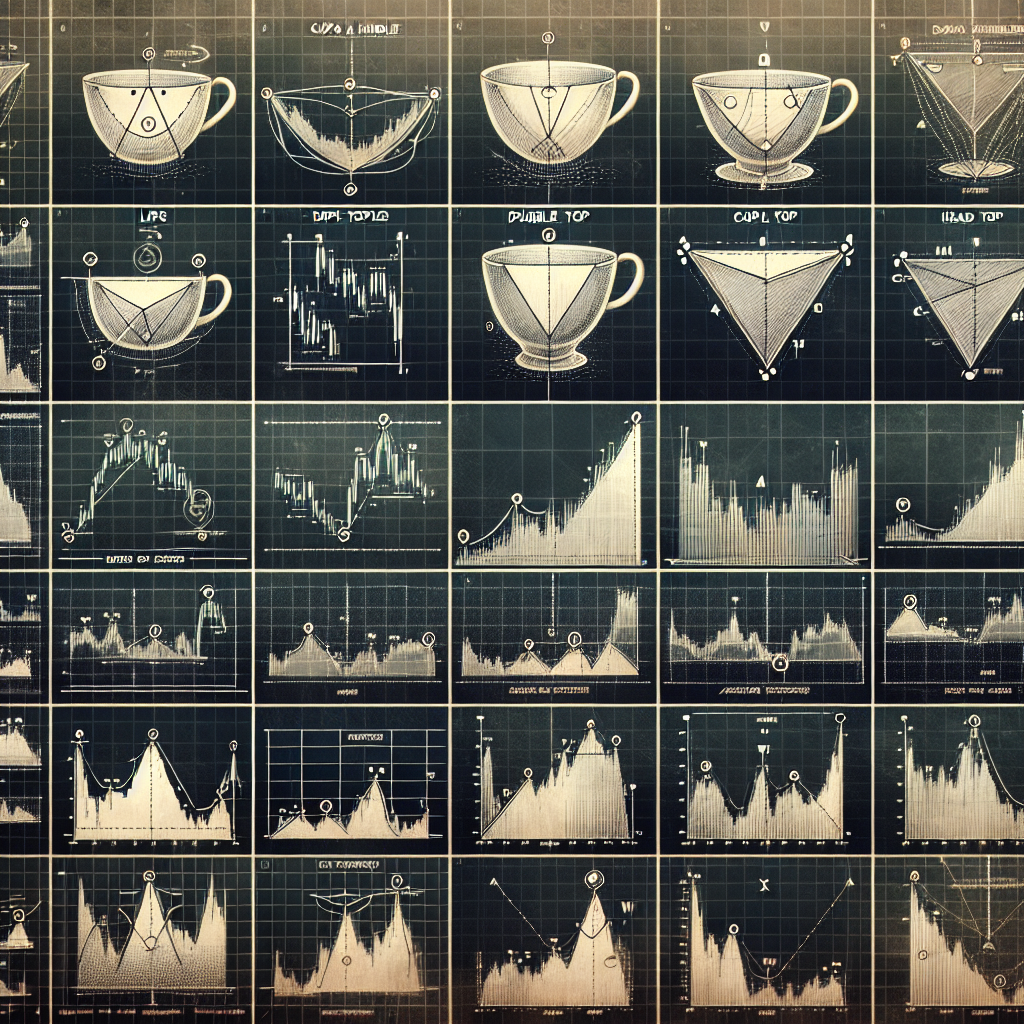
Let’s explore the most frequently observed chart patterns, grouped into reversal and continuation categories, to better predict market movements.
Reversal Patterns
Reversal patterns are critical since they indicate a potential change in market direction. Here are some to watch for:
Head and Shoulders
This pattern comprises three peaks, with the middle peak (the head) being the highest and the two others (shoulders) being lower but roughly at the same level. A “neckline” is drawn through the lowest points of the two troughs. The pattern signals a bullish-to-bearish trend reversal.
Double Top and Double Bottom
The Double Top is a bearish reversal pattern that appears after an uptrend, marked by two consecutive peaks of similar height, followed by a decline. Conversely, a Double Bottom is a bullish reversal pattern following a downtrend, consisting of two consecutive lows of similar depth, followed by a rise. These patterns are confirmed when the price breaks the neckline connecting the low points between the two peaks or troughs.
Continuation Patterns
Continuation patterns suggest that the current market trend is likely to continue after a brief pause. Some common ones include:
Triangles
Triangles can be ascending, descending, or symmetrical. They are formed by converging trend lines and can signal consolidation before the trend resumes. Ascending triangles have a flat upper trend line and a rising lower trend line, indicating bullish continuation. Descending triangles have a flat lower trend line and a descending upper trend line, suggesting bearish continuation. Symmetrical triangles have converging trend lines with a similar slope, pointing to a pause in trend momentum without indicating direction.
Flags and Pennants
Flags and pennants resemble each other, characterized by a strong price movement followed by a consolidatory rectangular (flag) or triangular (pennant) pattern. The main difference is the shapes they form: flags look like rectangles, while pennants form small symmetrical triangles. Both signal continuation when the price breaks out of the formation in the direction of the preceding trend.
Conclusion
The ability to identify and interpret common chart patterns is a fundamental skill for participants in the financial markets. It enables traders and investors to make more informed decisions by anticipating potential market movements. While no pattern guarantees a specific outcome, combining pattern analysis with other technical and fundamental tools can improve market analysis and trading performance. Remember, practice and experience are crucial in mastering the art of chart pattern recognition.